
Stock Market Data Dashboard
AI Generated Image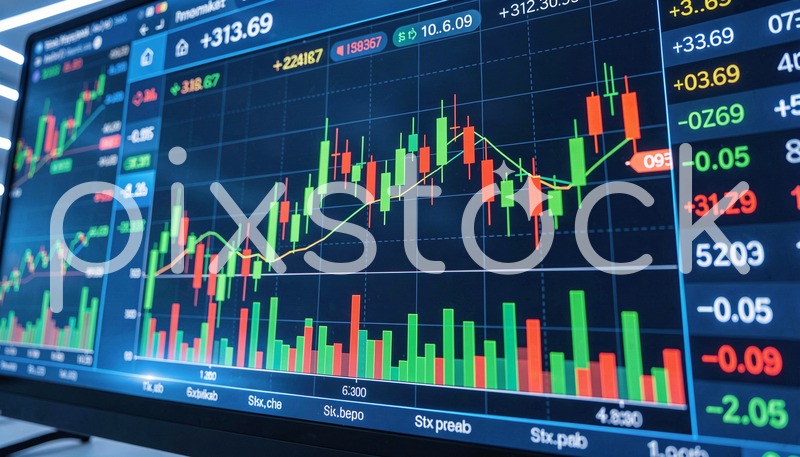
Description
Dynamic financial market data display featuring candlestick charts with green and red bars, numerical values indicating gains and losses, and fluctuating line graphs on a blue digital background. Visual elements emphasize real-time stock price movements and market activity.
What you can use it for
- Websites
- Advertising
- Social media
- Client projects
- No attribution